

POLICE BLOTTER
The Police Blotter; a Crime, Incident and Activity Log contains information entered by dispatch,CSO's, call takers, and the resulting action(s) by FHDA officers.
The Annual Report required by the Clery Act contains all Clery Act defined crimes which occurred on campus locations but does not include all incidents reported in the Police Blotter. The Crime, Incident and Activity Log captures incidents, both on and off campus, which are reported to FHDA Police Department and also includes self initiated activity.
Police Blotter
2026
|
|
|
|
|
|
|
|
July Log |
August Log |
|
September Log |
October Log |
November Log |
December Log |
2025
|
|
|
|
|
|
|
|
|
|
|
|
|
|
|
2024
|
|
|
|
|
|
|
|
|
|
|
|
|
|
|
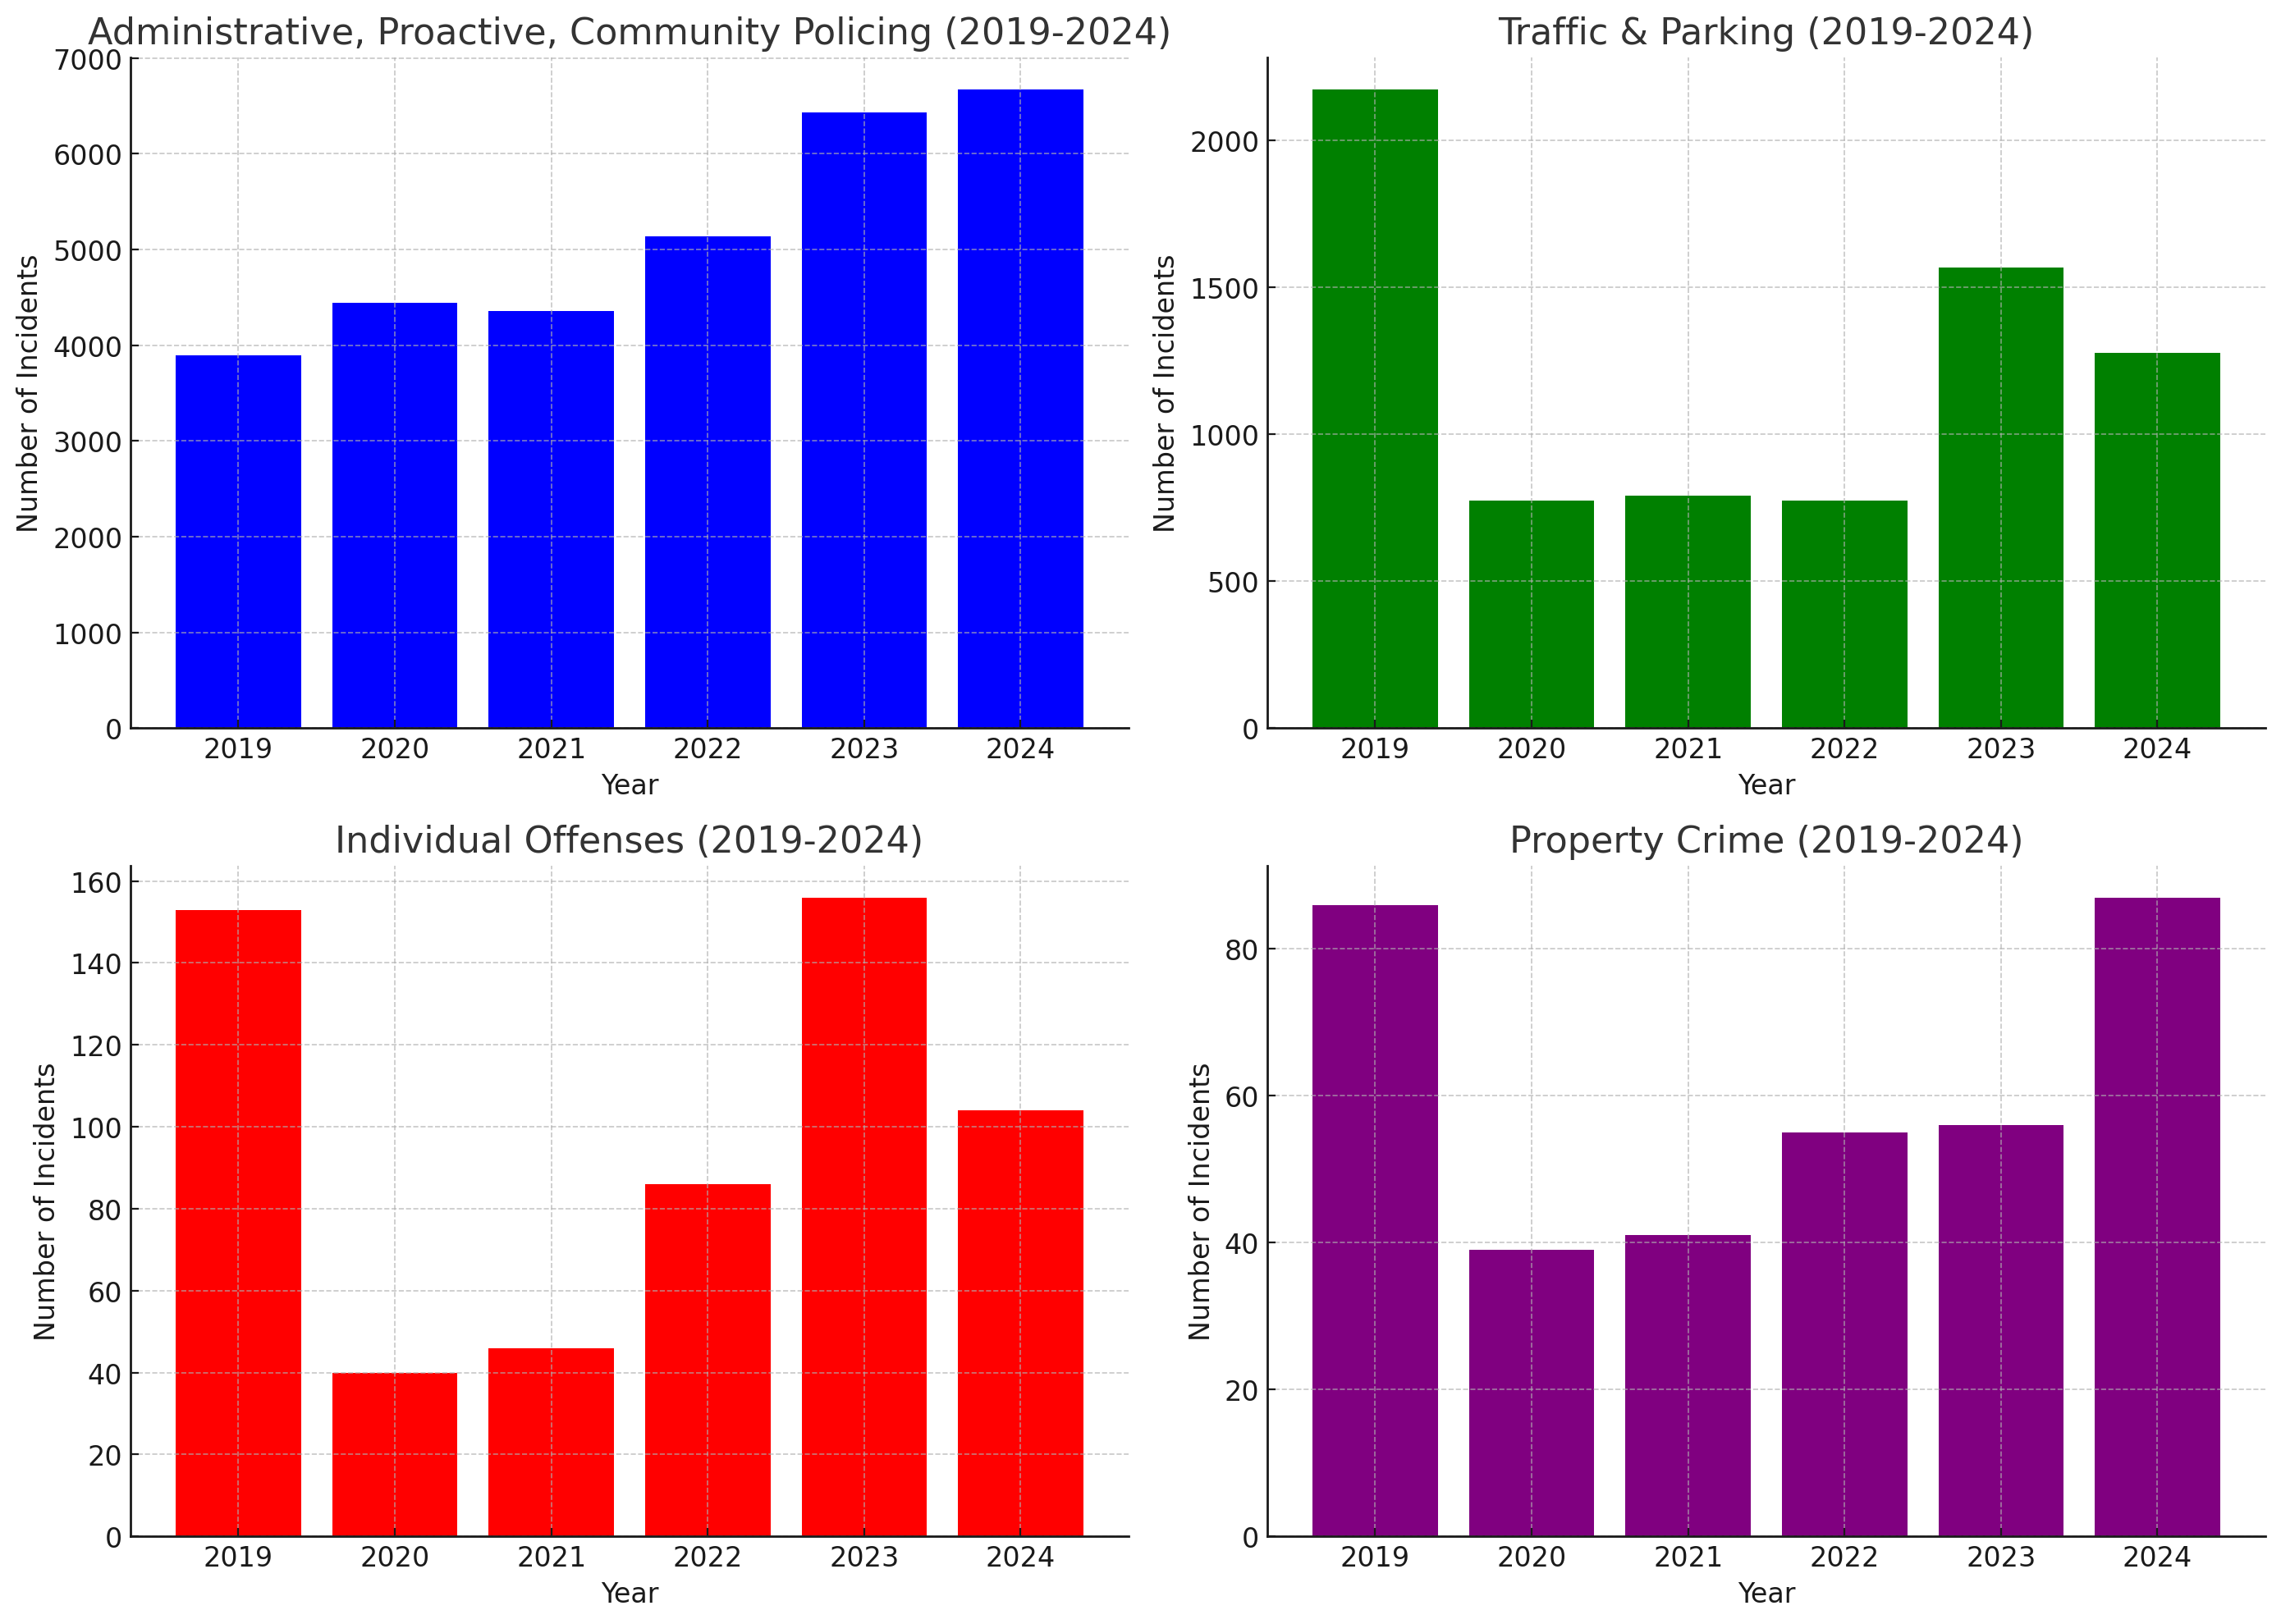
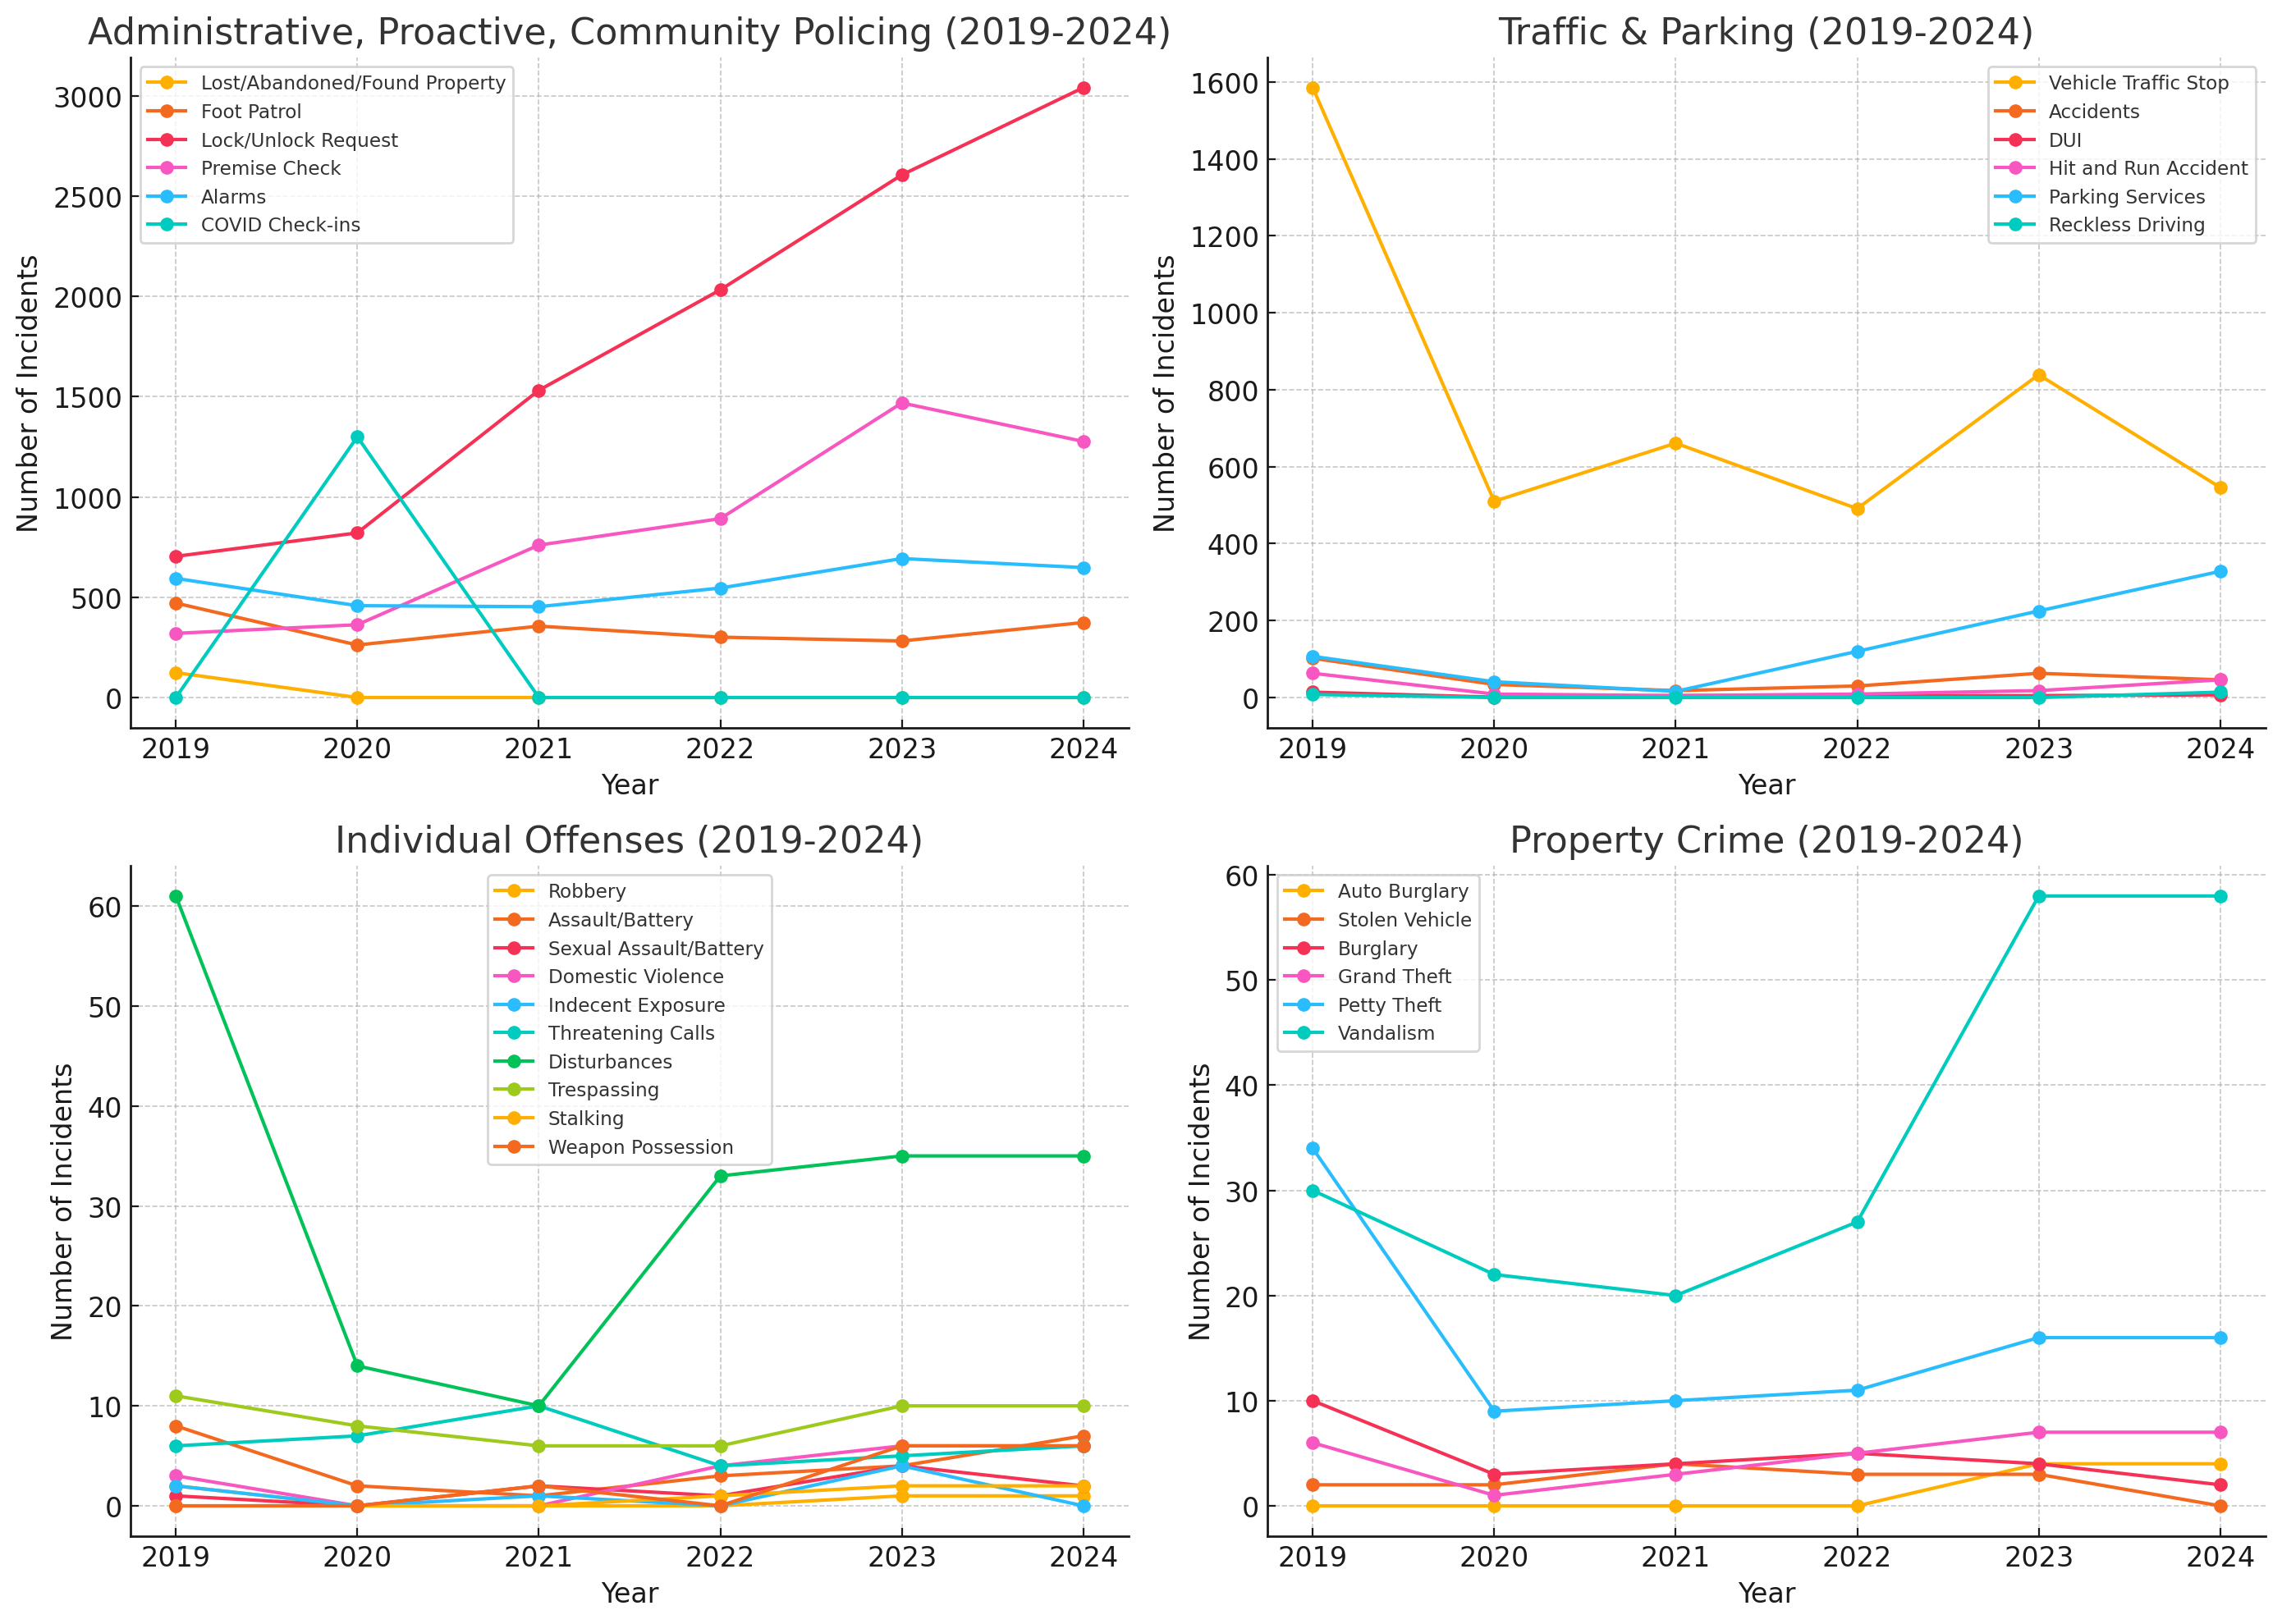
Key Findings 2019 - 2024
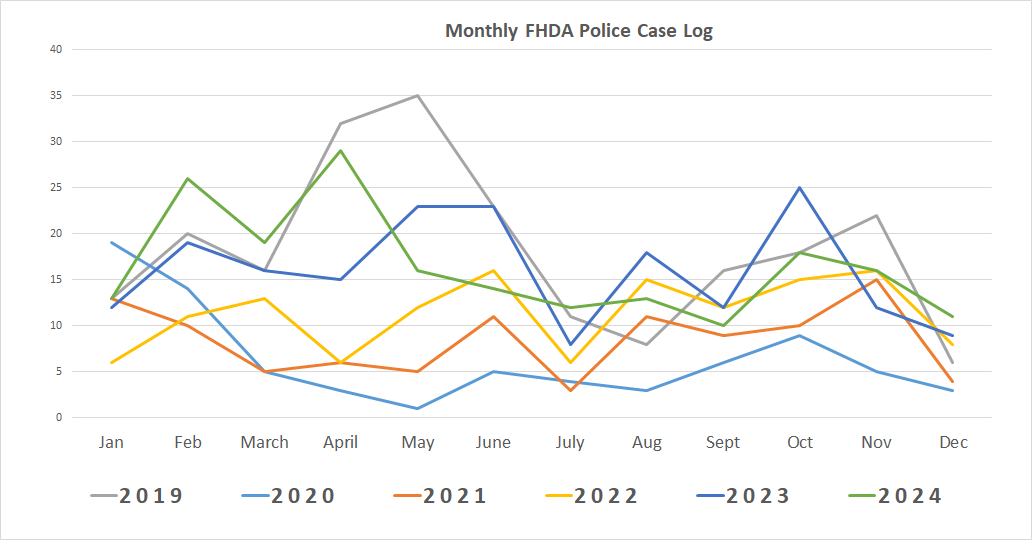
Increase in Cases Over Time
- The number of cases significantly decreased from 220 in 2019 to 77 in 2020, due to external factors (COVID lockdowns)
- From 2020 onward, cases steadily increased every year, reaching 197 in 2024, nearly back to 2019 levels.
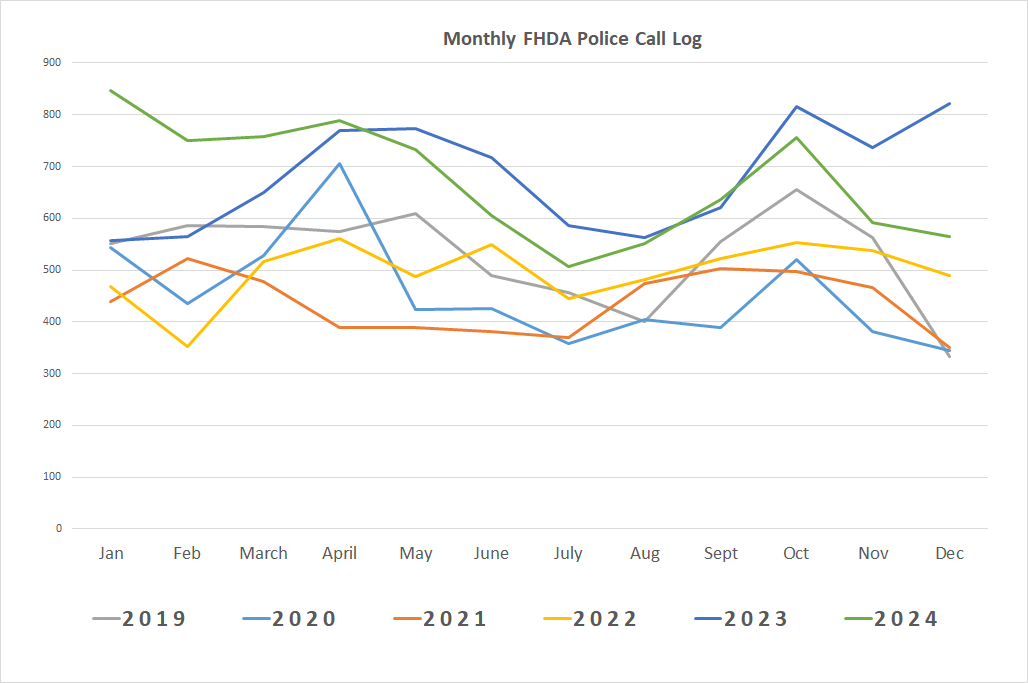
Calls for Service Growth
- The number of calls for service consistently rose after a dip in 2020. Starting at 6,359 in 2019, calls dropped to 5,461 in 2020, then increased annually, reaching 8,089 in 2024.
- This represents an overall increase of approximately 27% in calls for service between 2019 and 2024.
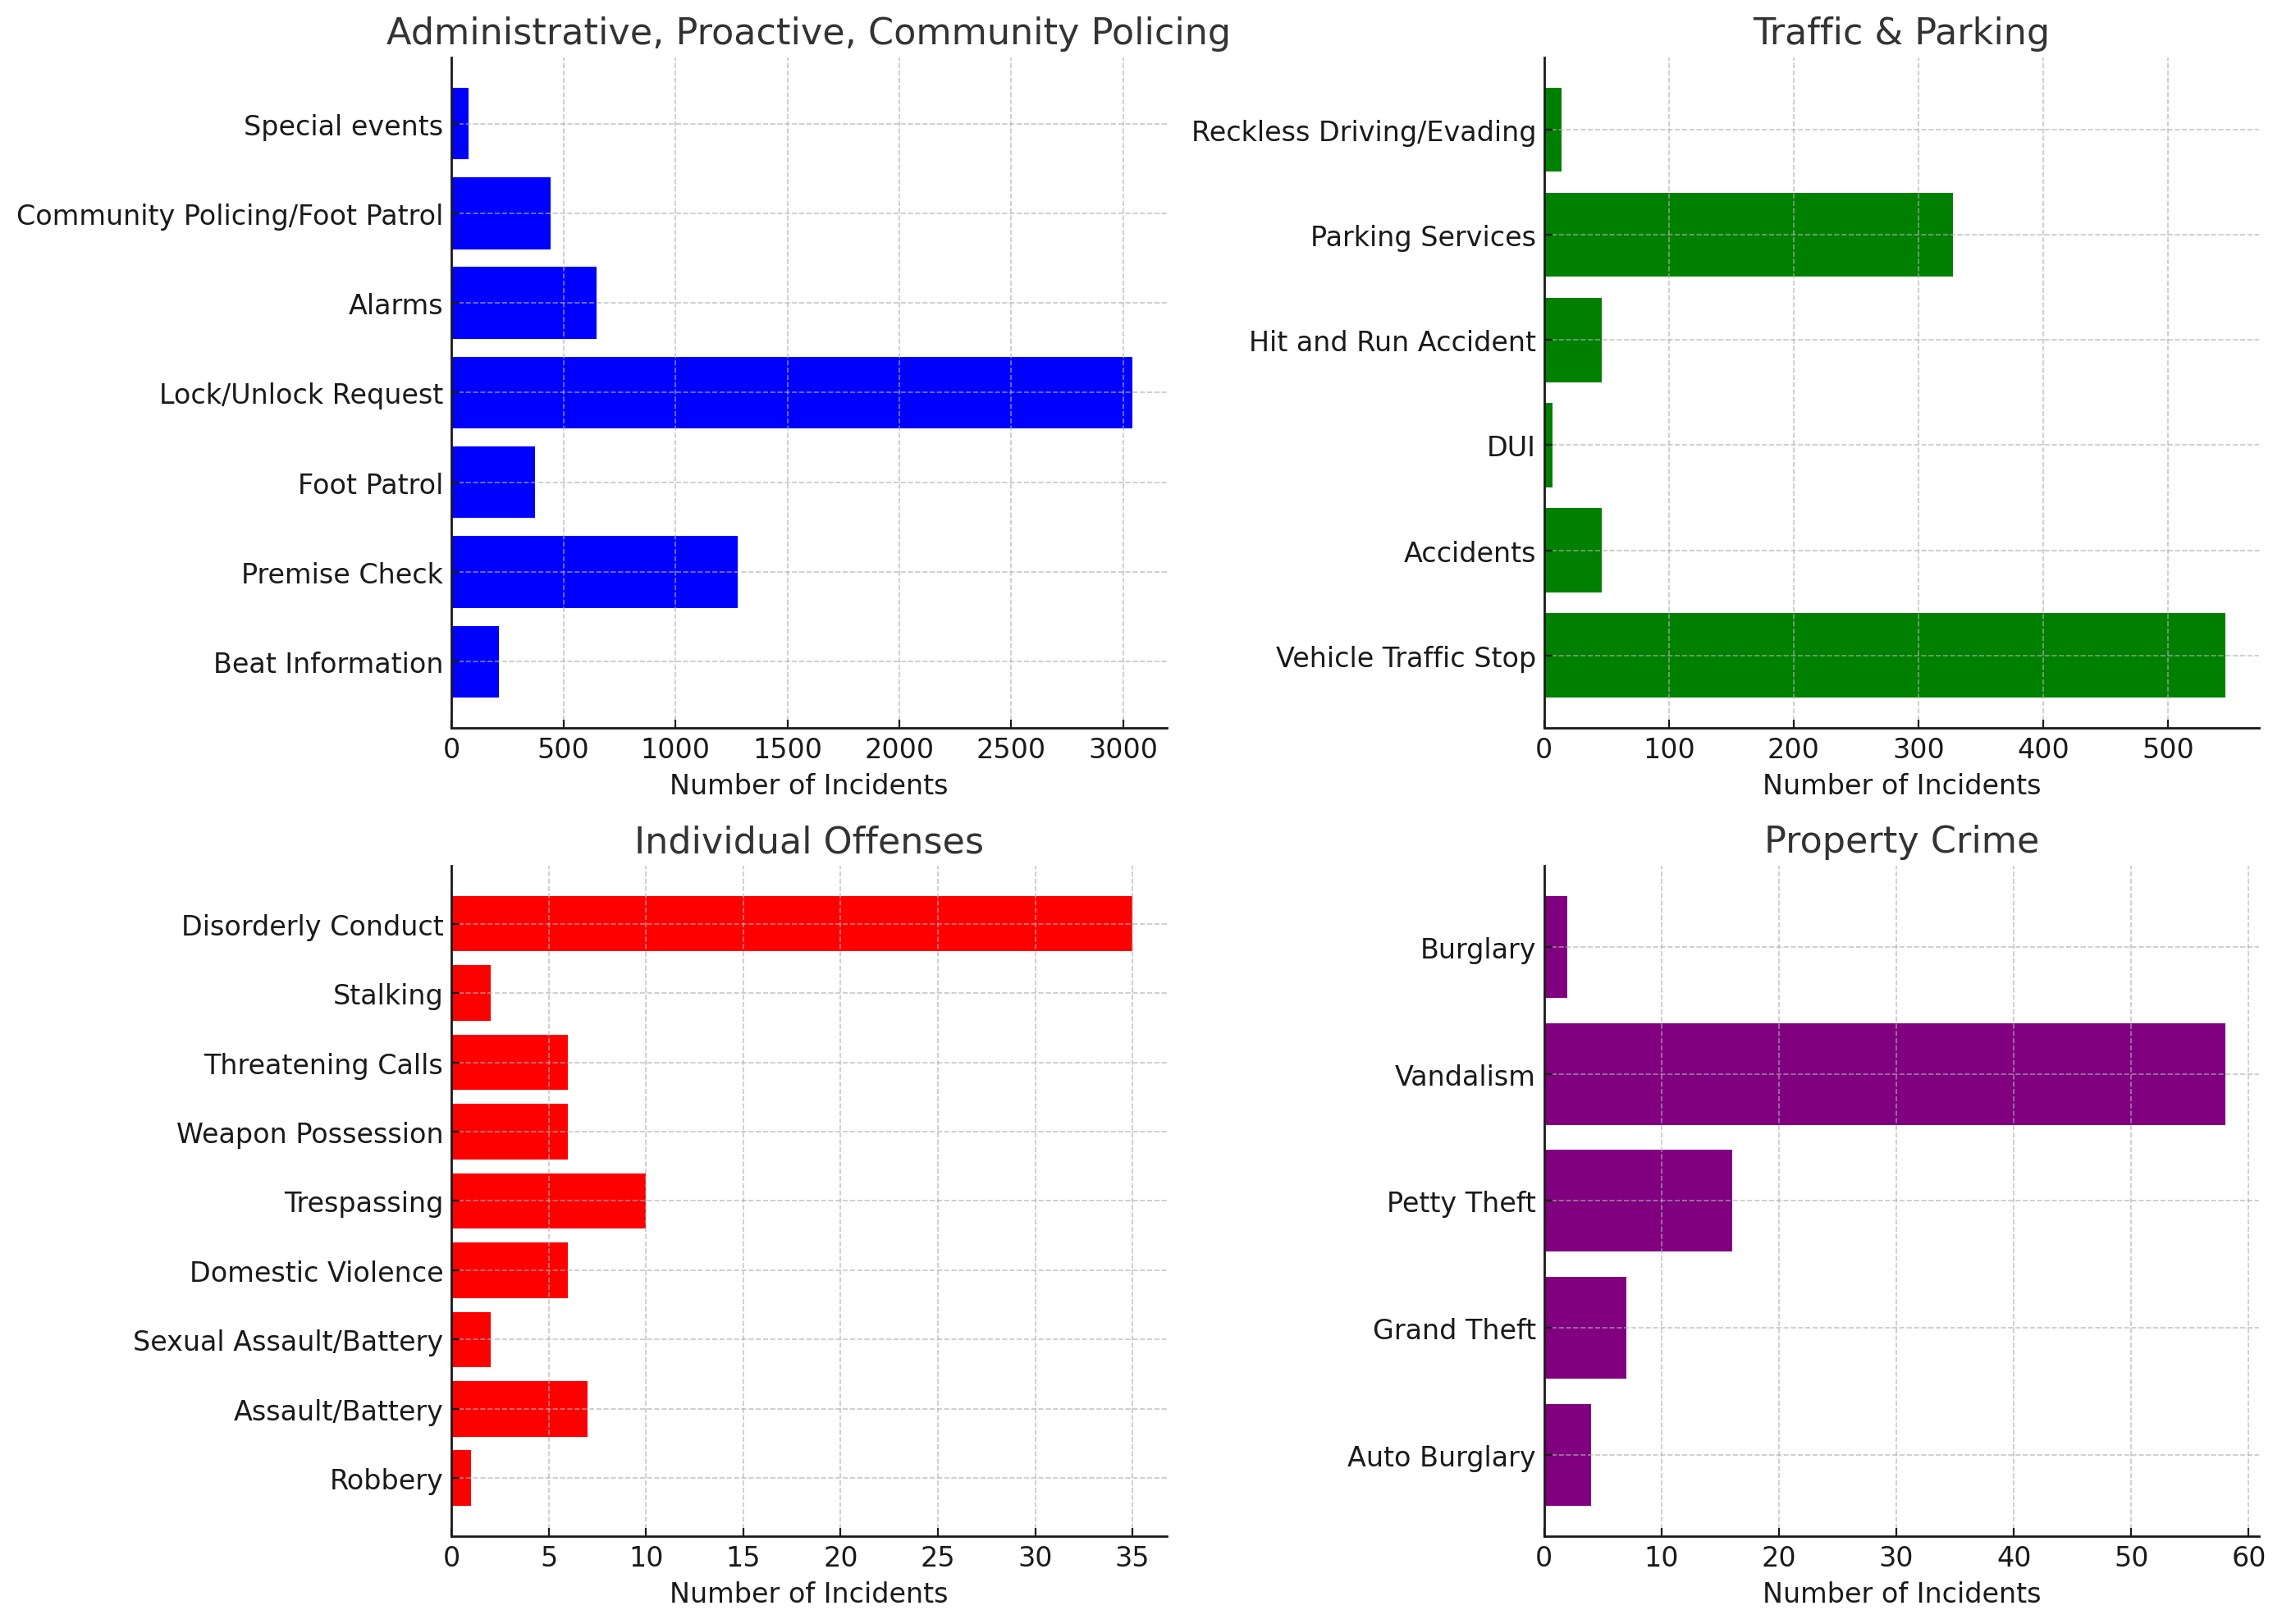
2024
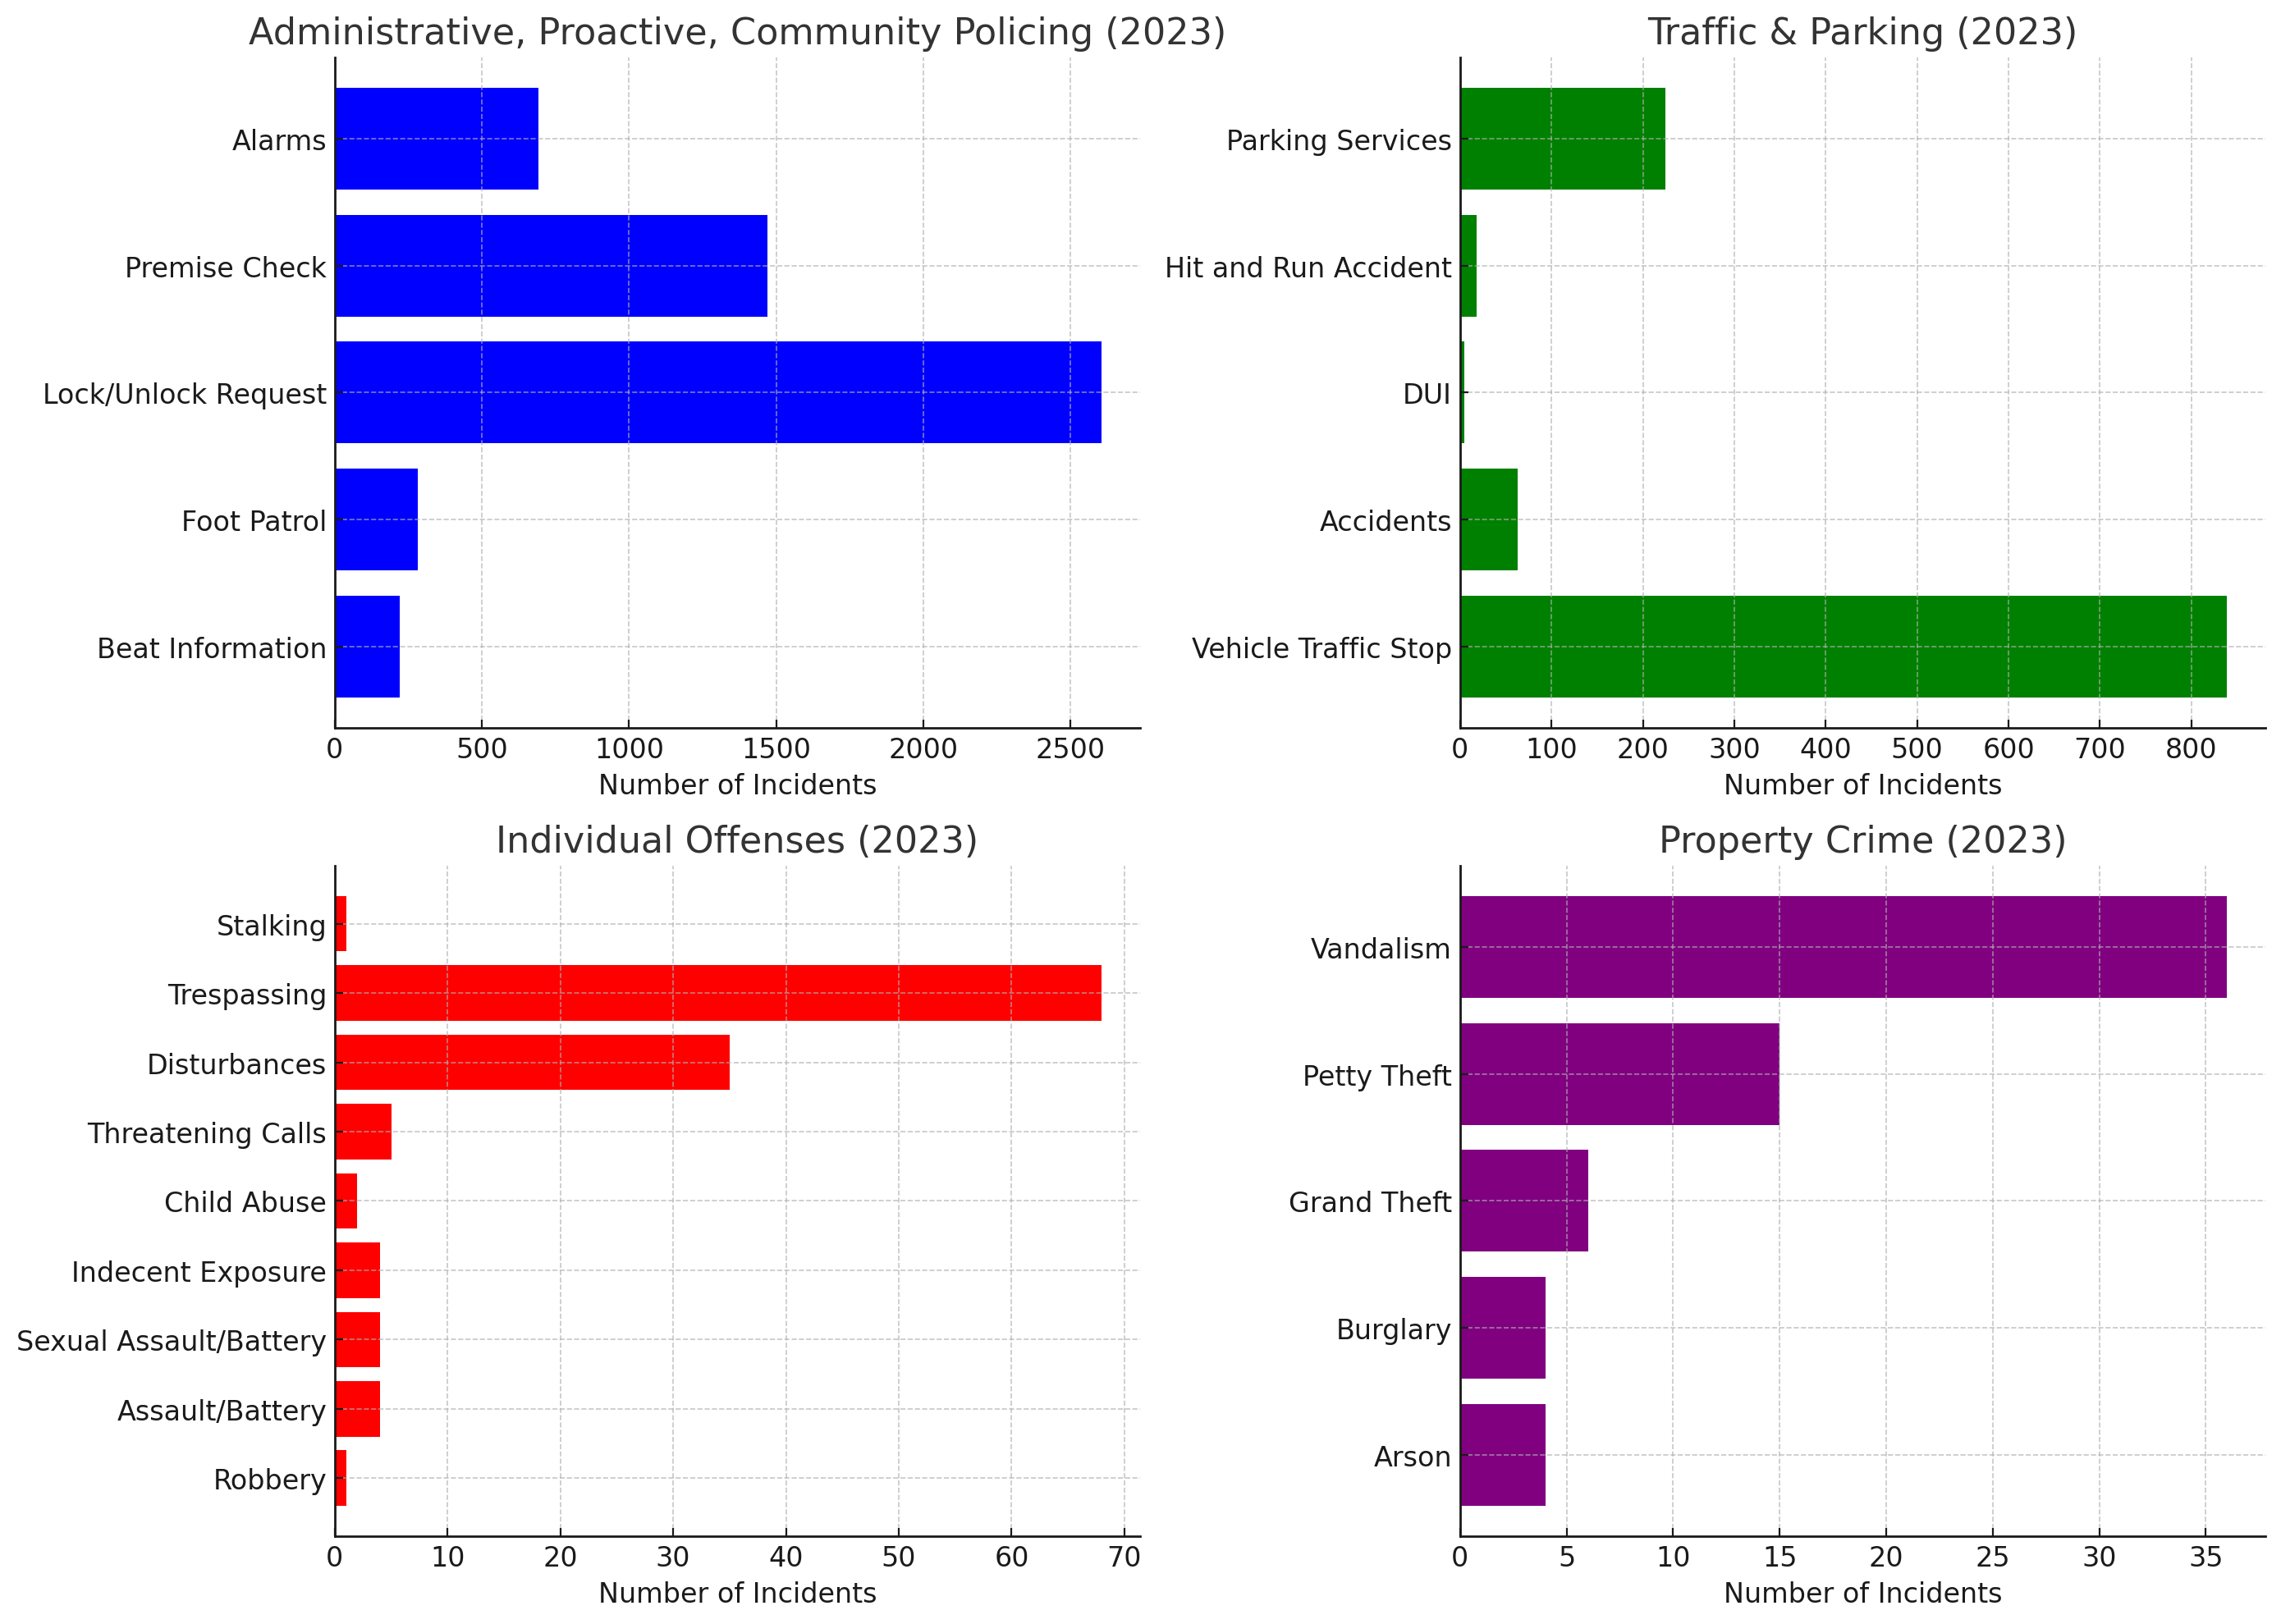
2023
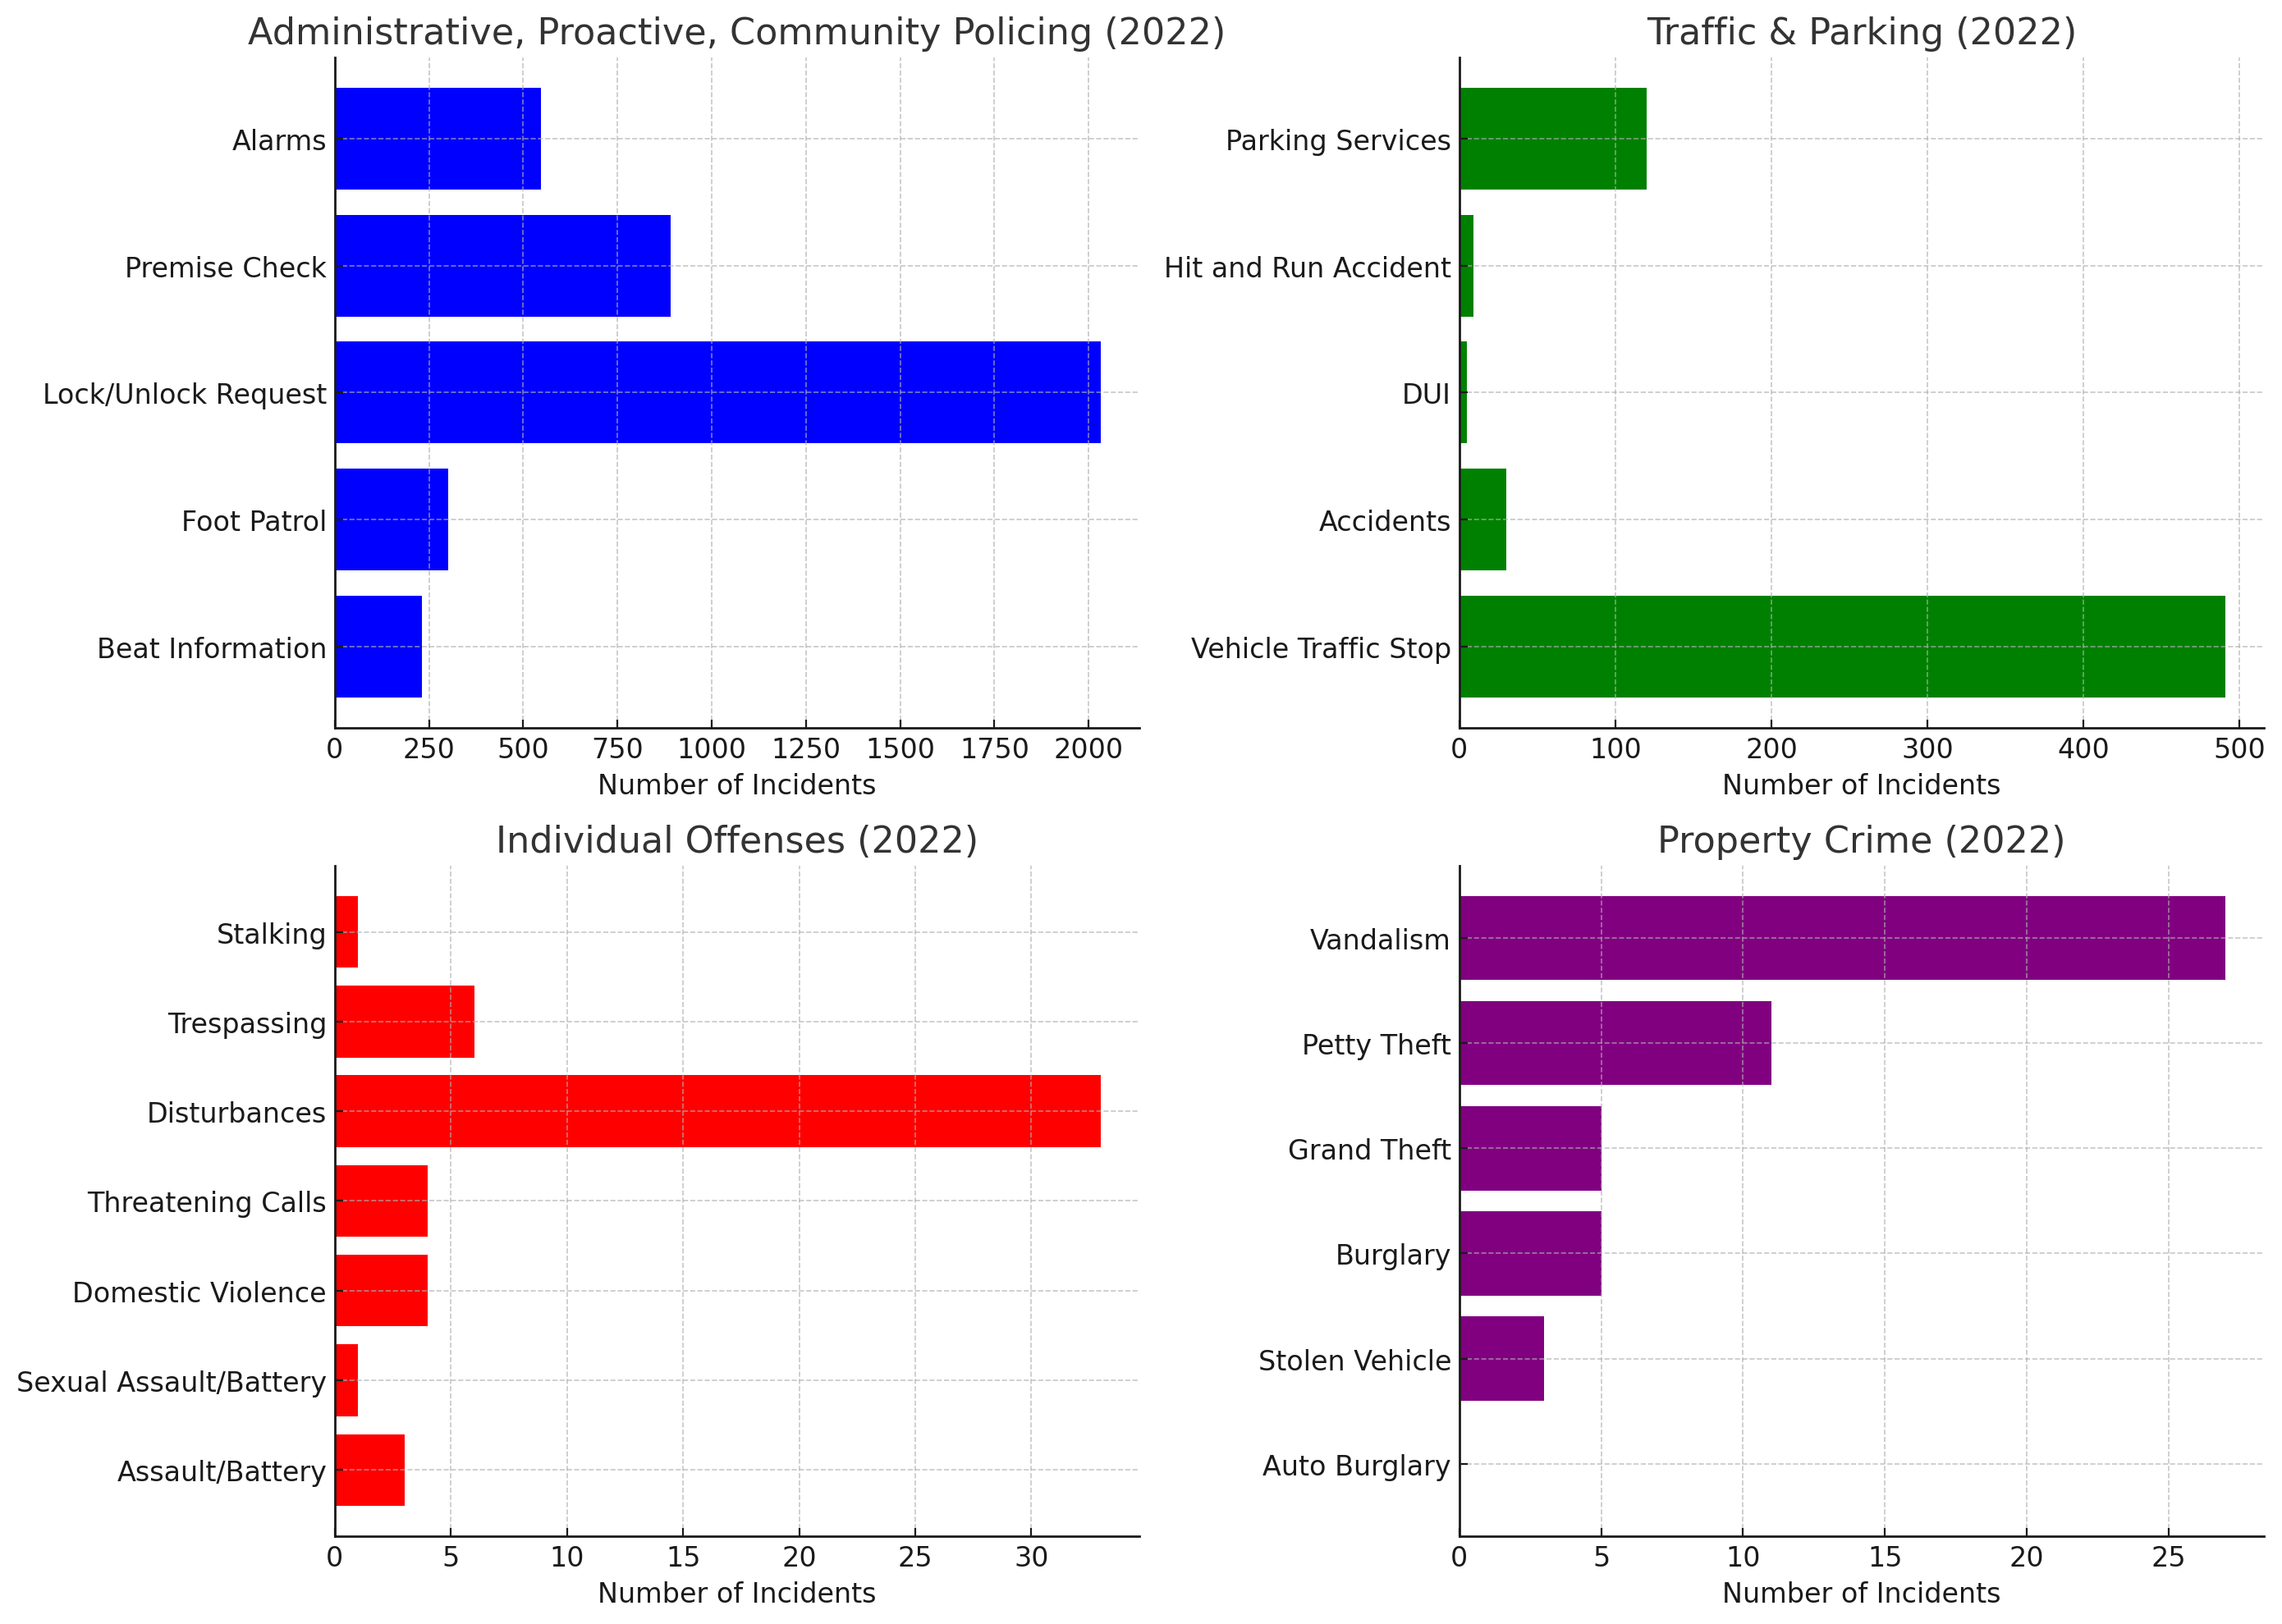
2022
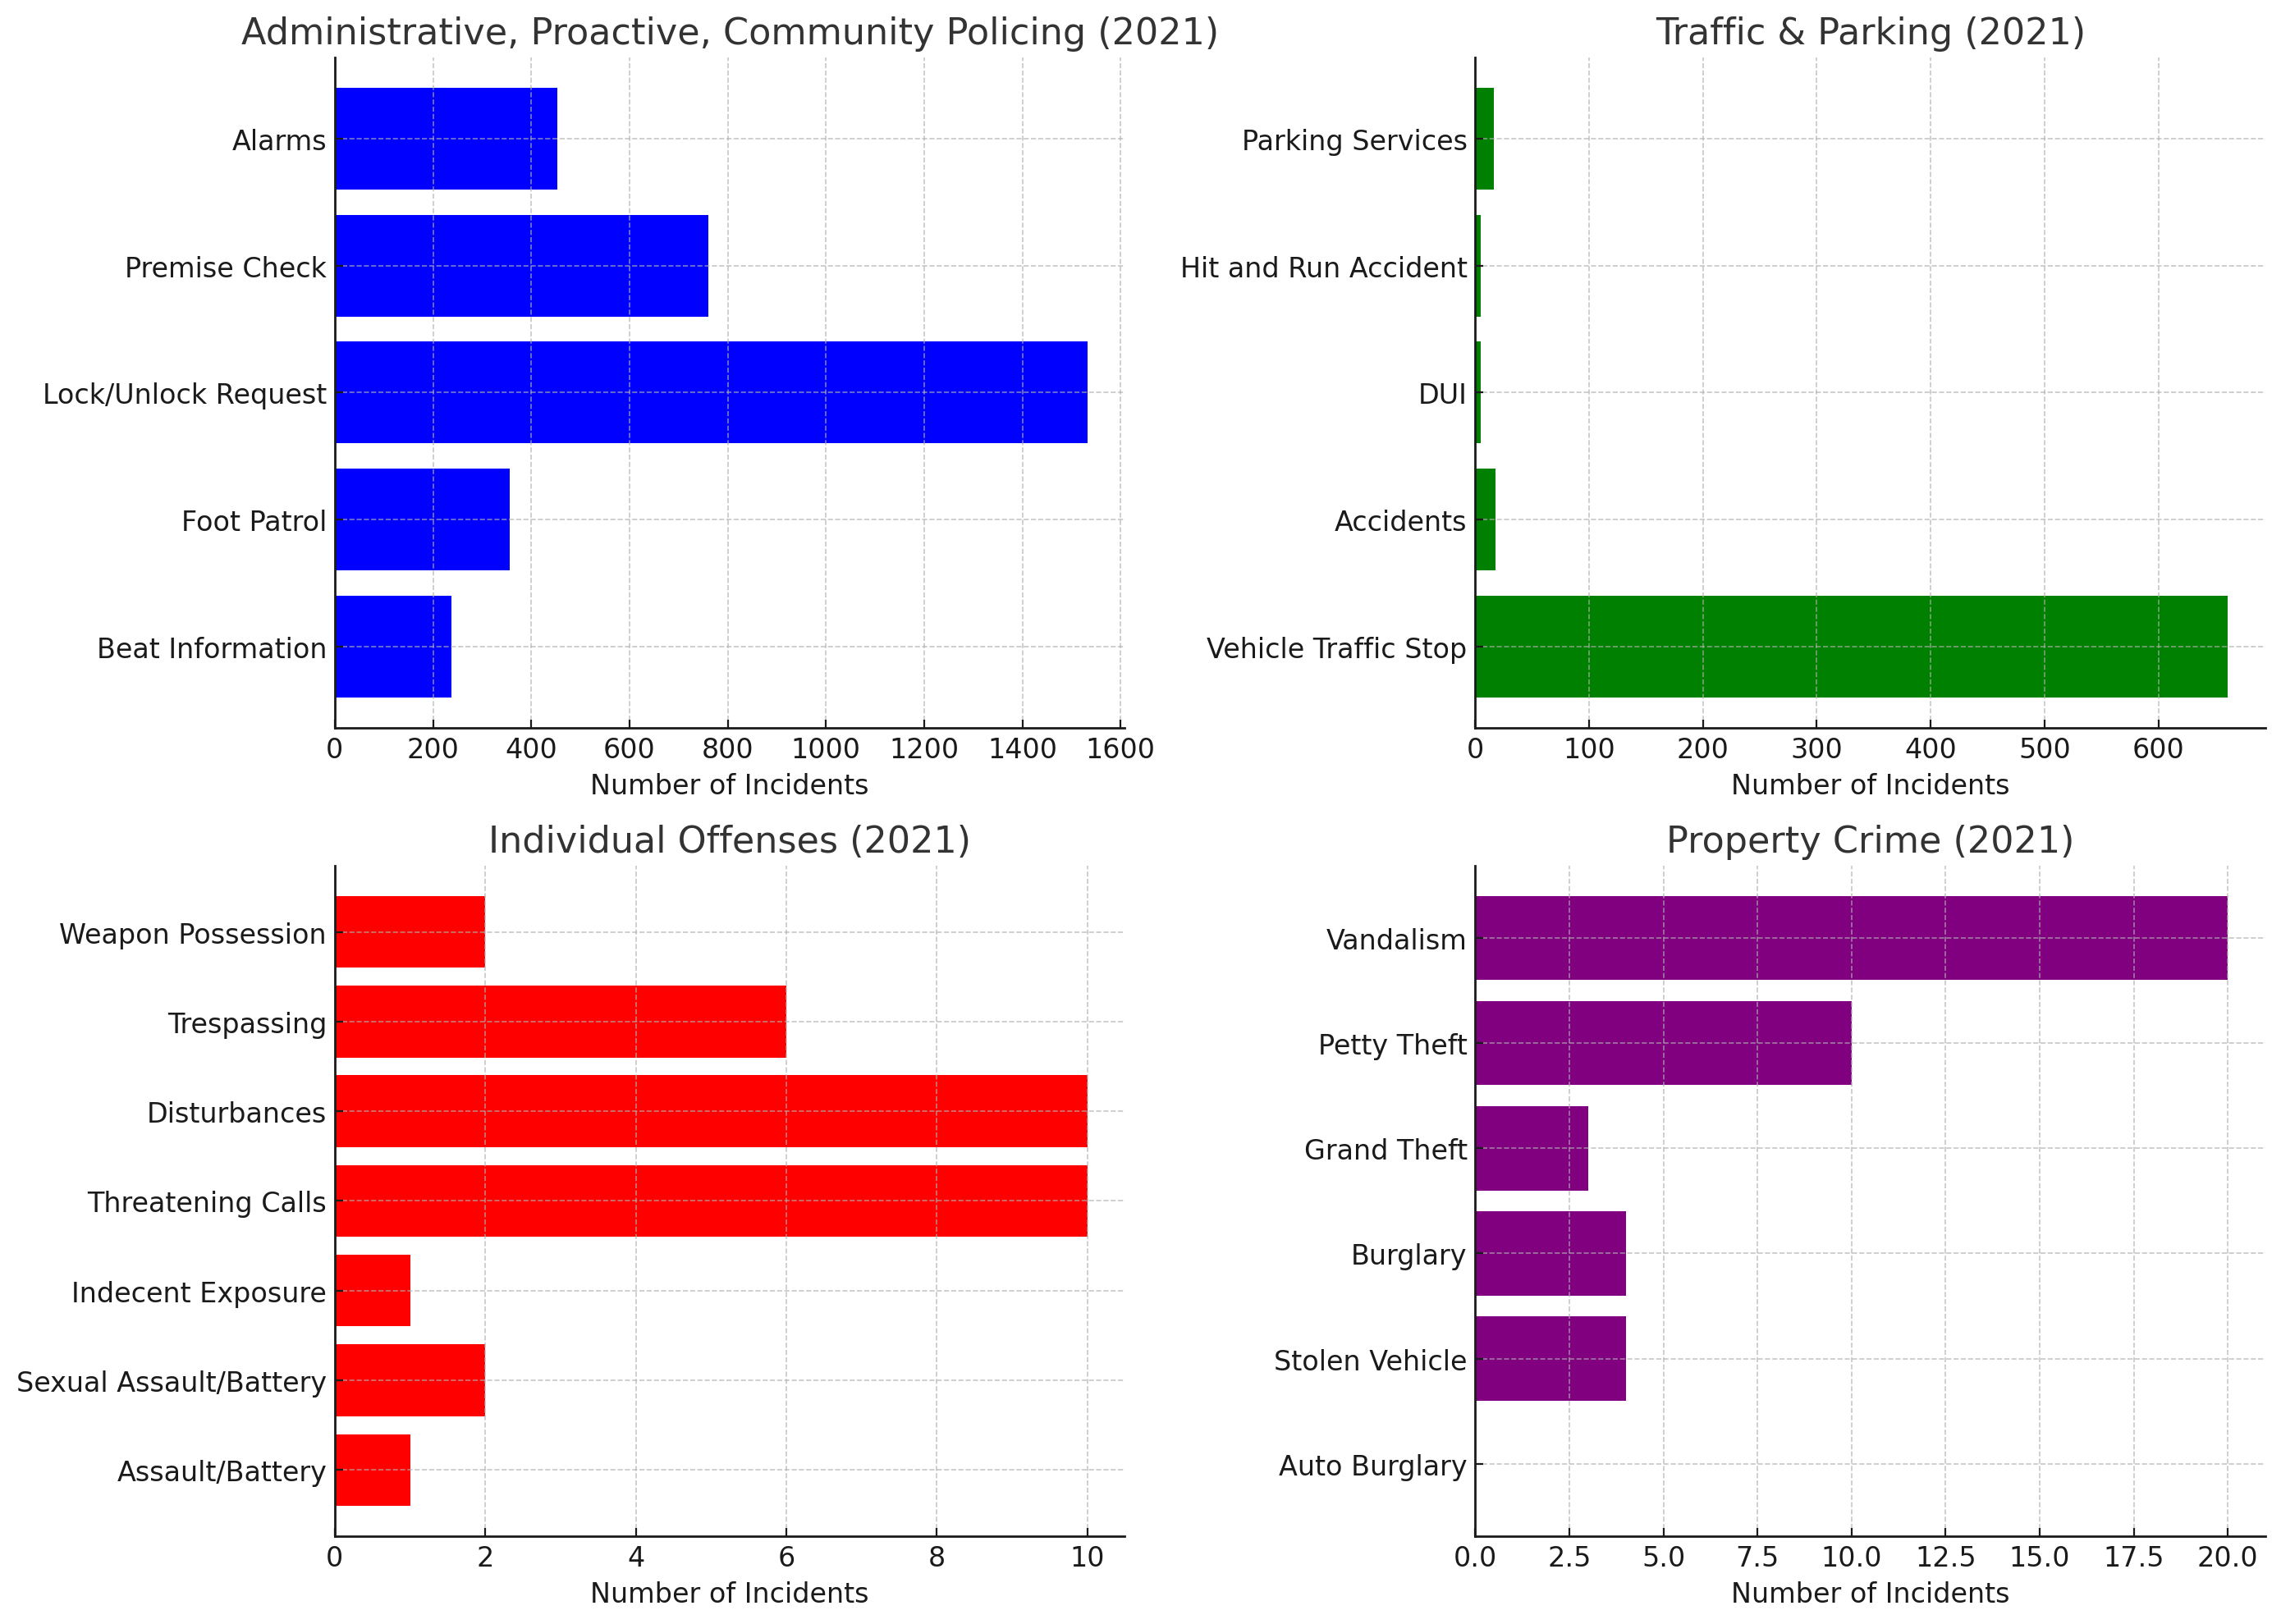
2021
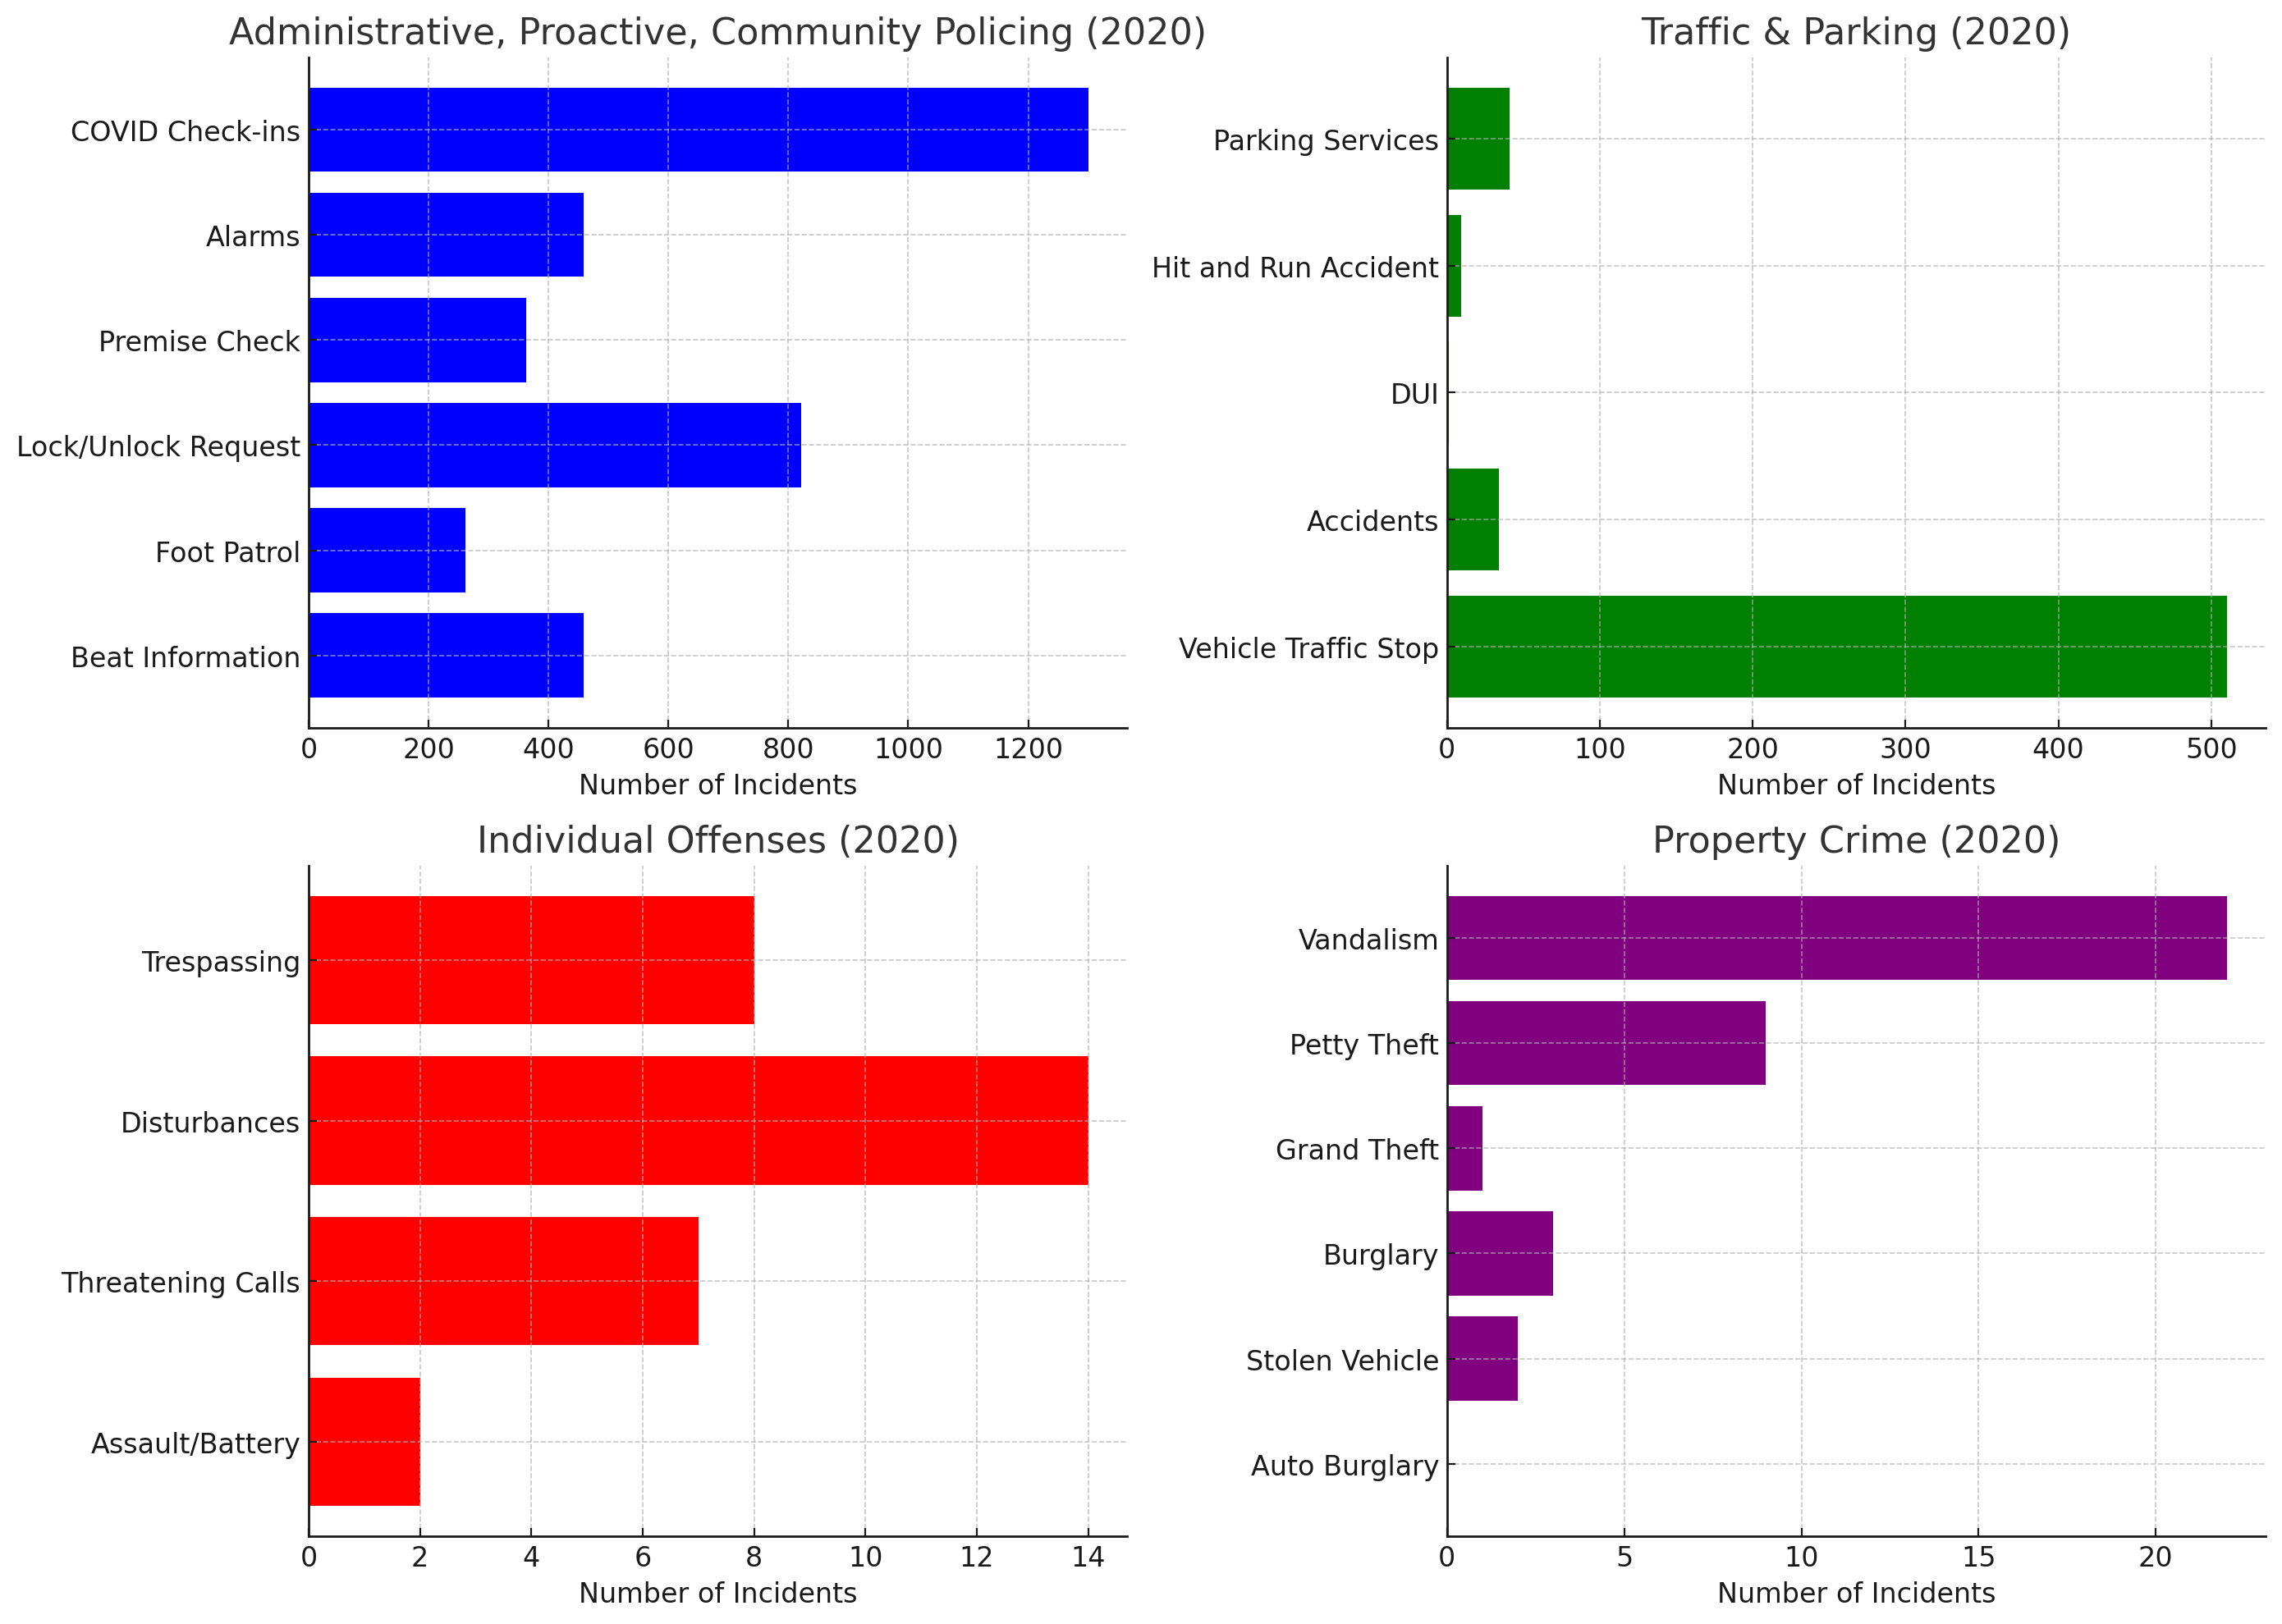
2020
2019